Our Data Analysis unit covers creating graphs and reading information from graphs. Students will be expected to be able to make a table to organize given information, then create a bar graph, line graph, or line plot. Students will also be expected to determine which type of graph should be used for the given information. Throughout this unit, we will also spend time making predictions based on a graph, and practice critically questioning information in a graph or table (such as What information does this graph not tell me? Does it skew the information in any way?) Part of the 5th grade standard does mention making inferences based on data in a graph, but this is more of an important skill students will need as they begin researching information on their own and finding data on the internet in the coming years.
Helpful Links:
Practice Answering Questions About Line Graphs (IXL)
Create Bar Graphs (simple)
Create Bar Graphs (advanced)
Create Line Graphs (simple)
Create Line Graphs (advanced)
Explanation of Line Plots (YouTube Video)
Create Line Plots (IXL)
Interpret Line Plots (IXL)
Create and Interpret Line Plots with Fractions (IXL)
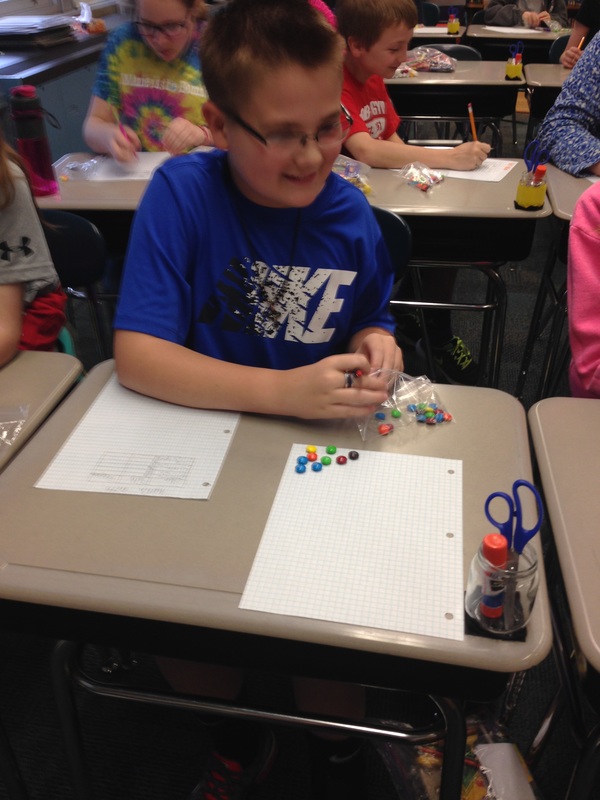
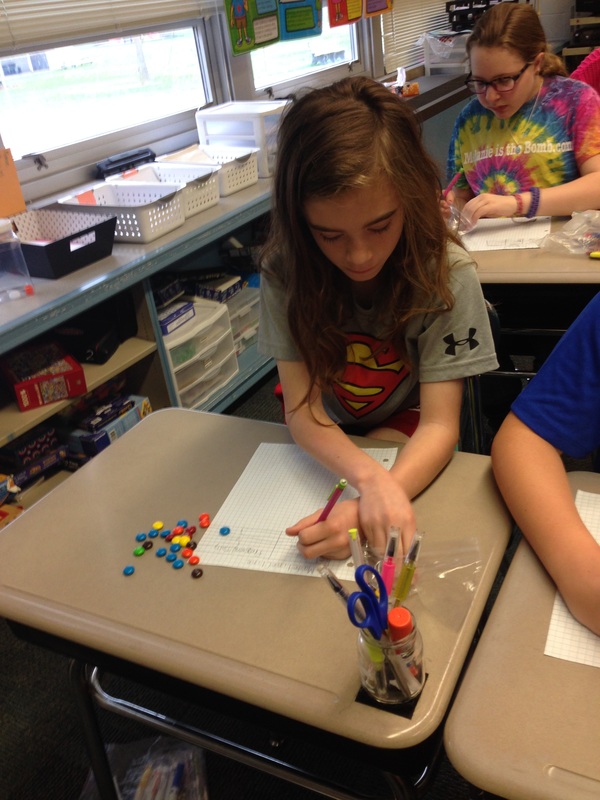
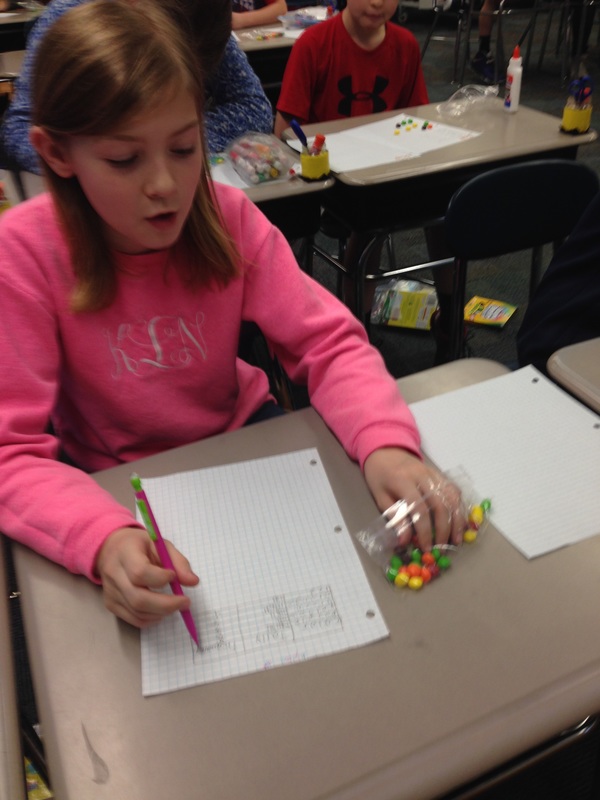
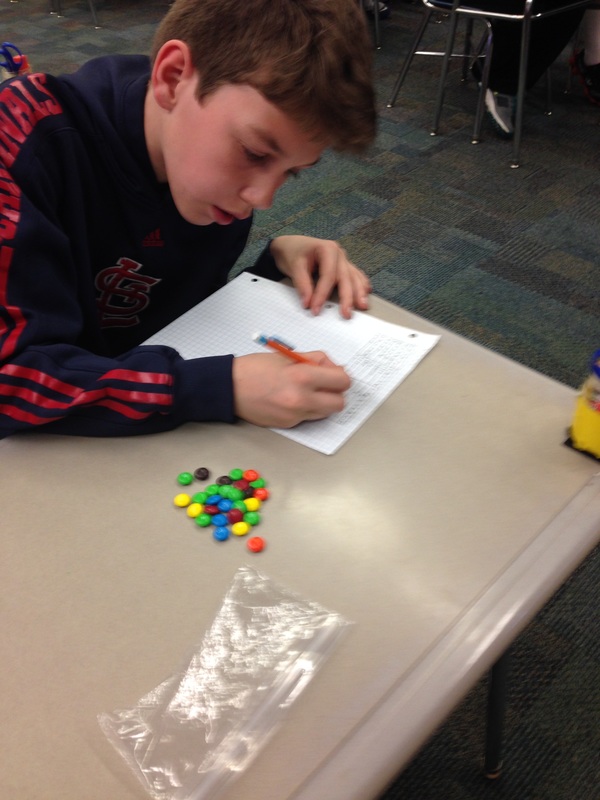
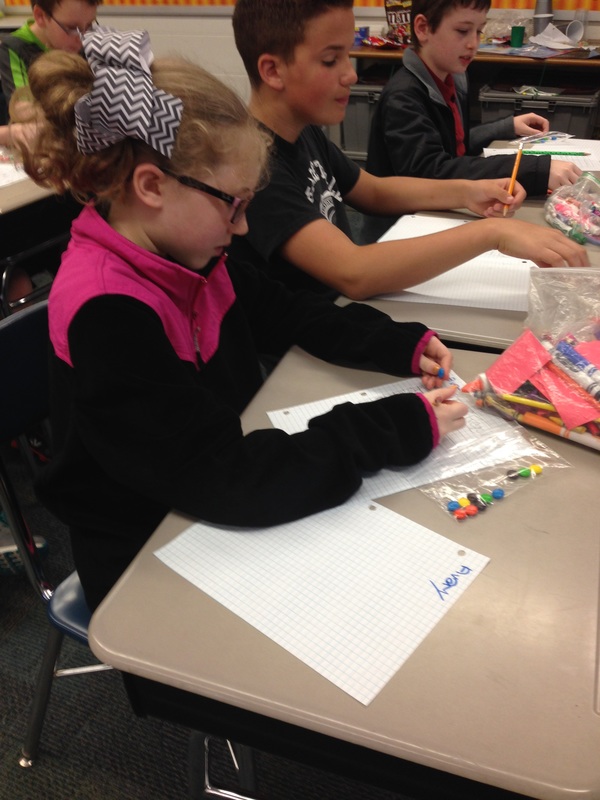
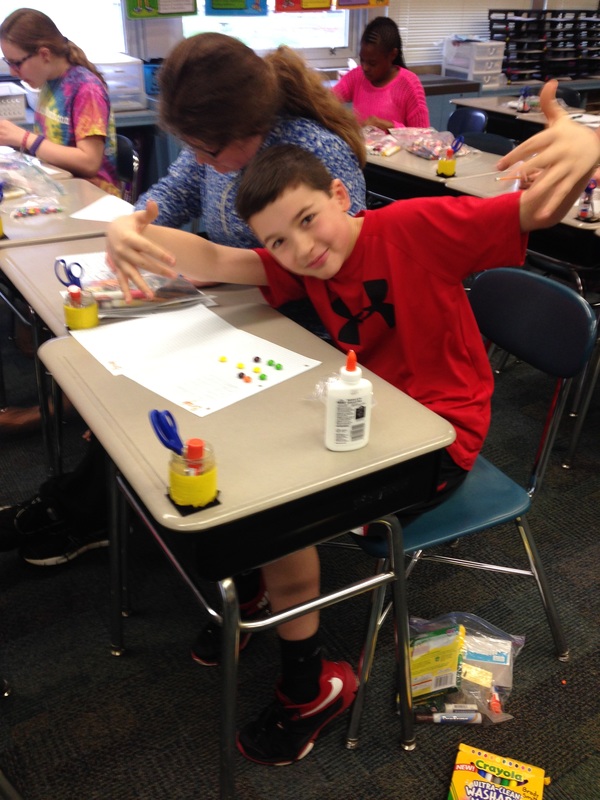
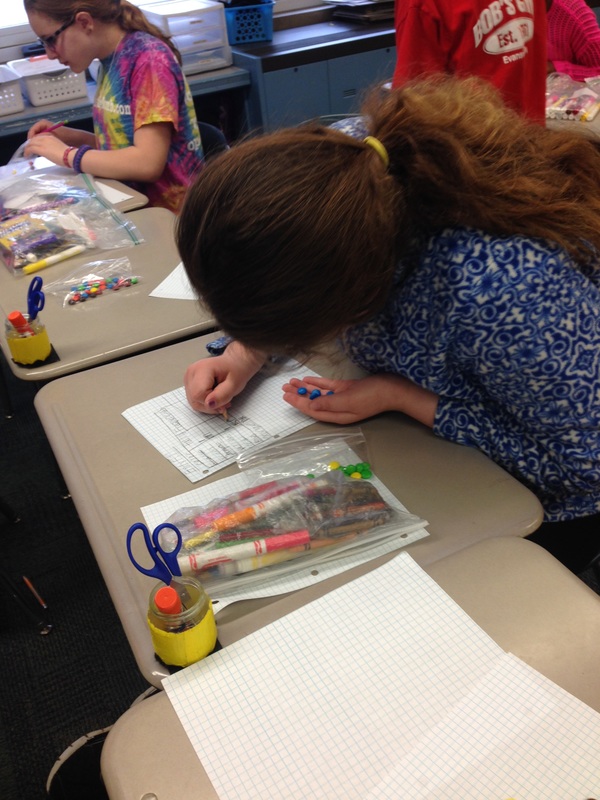
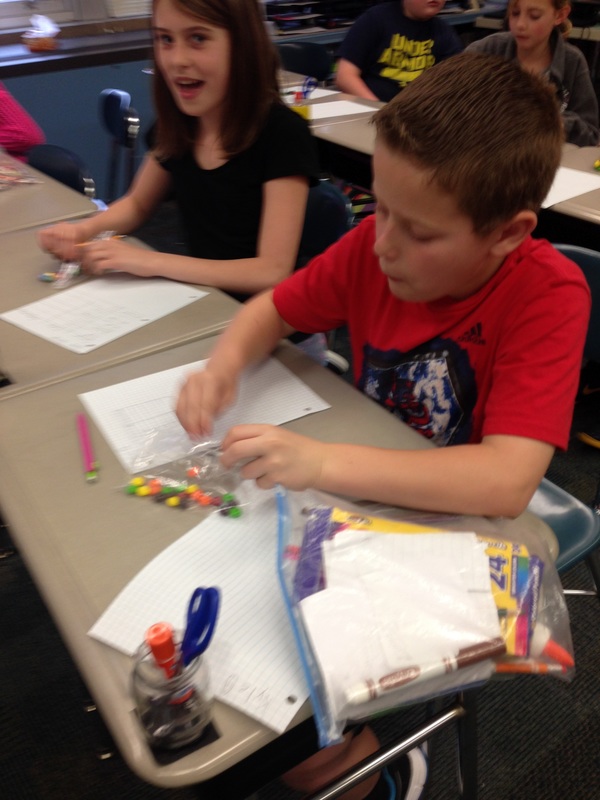
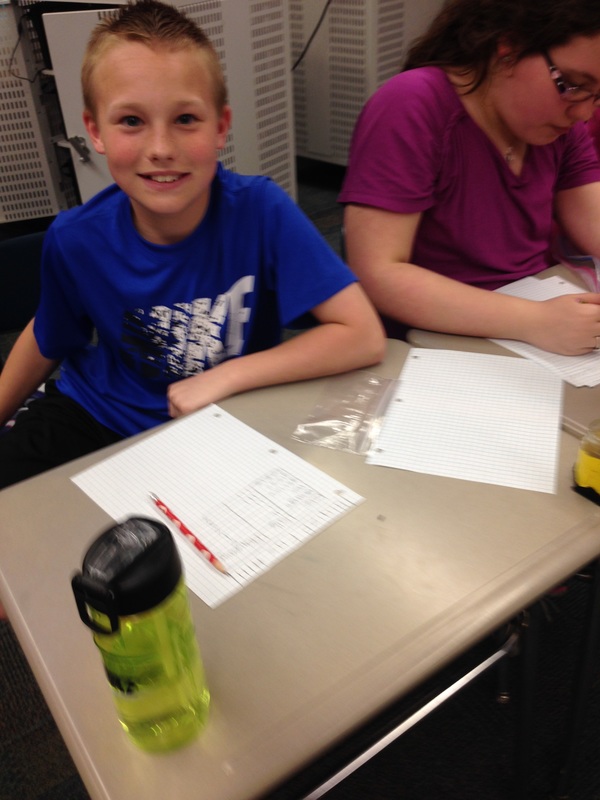
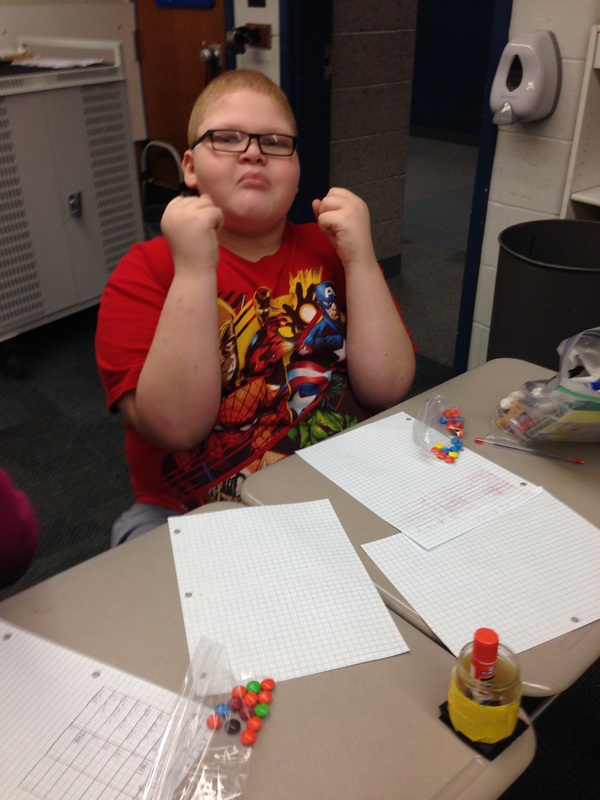
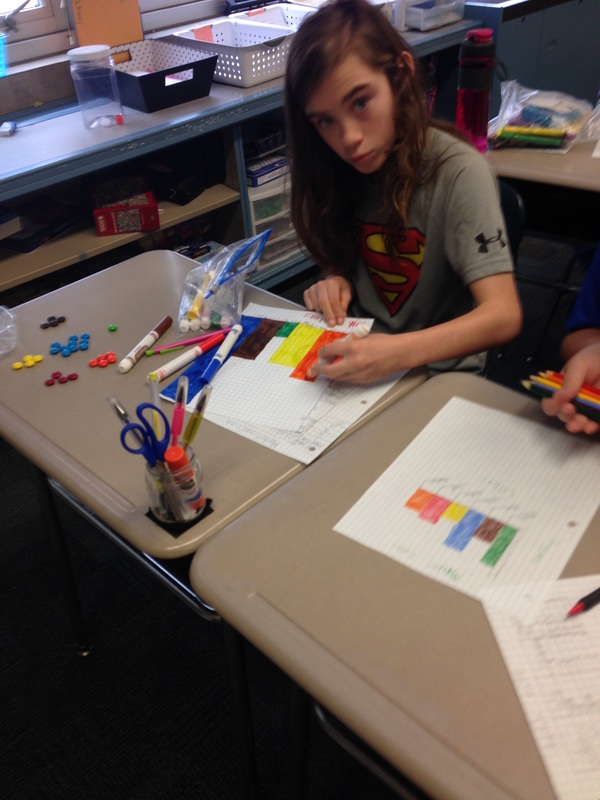
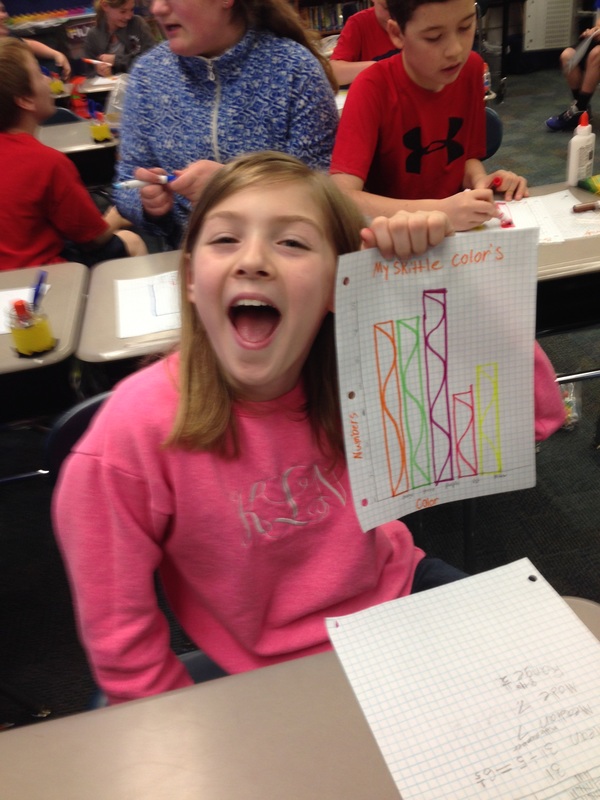
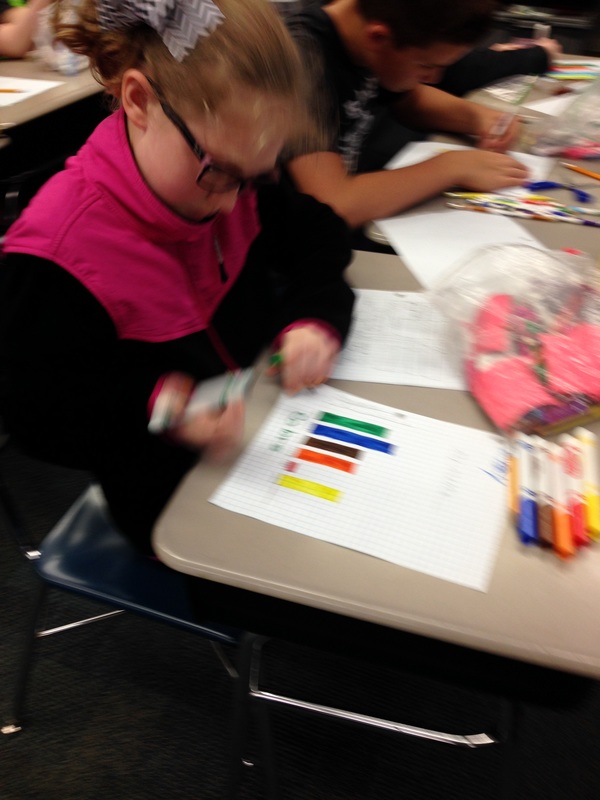
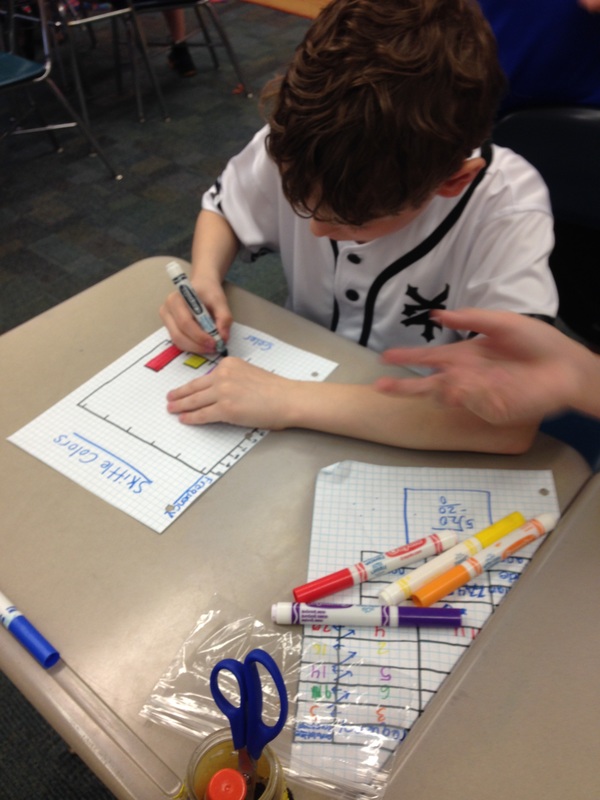
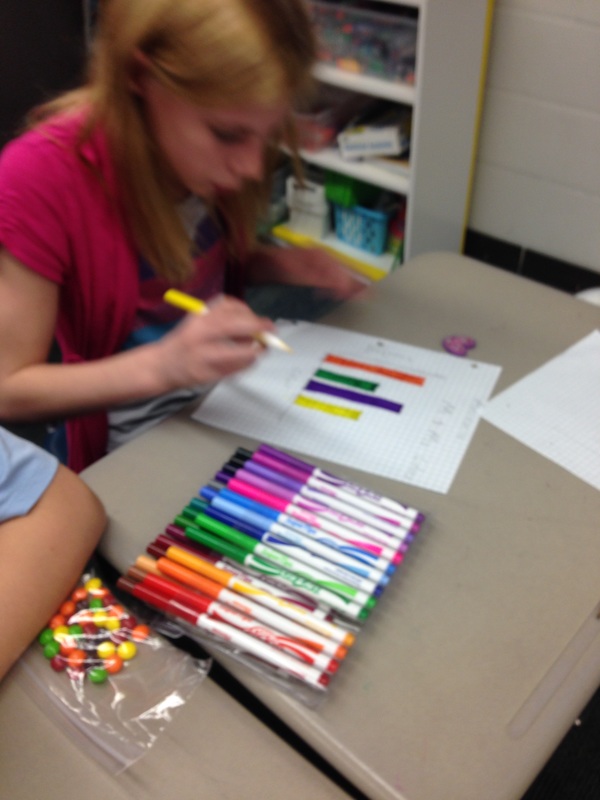
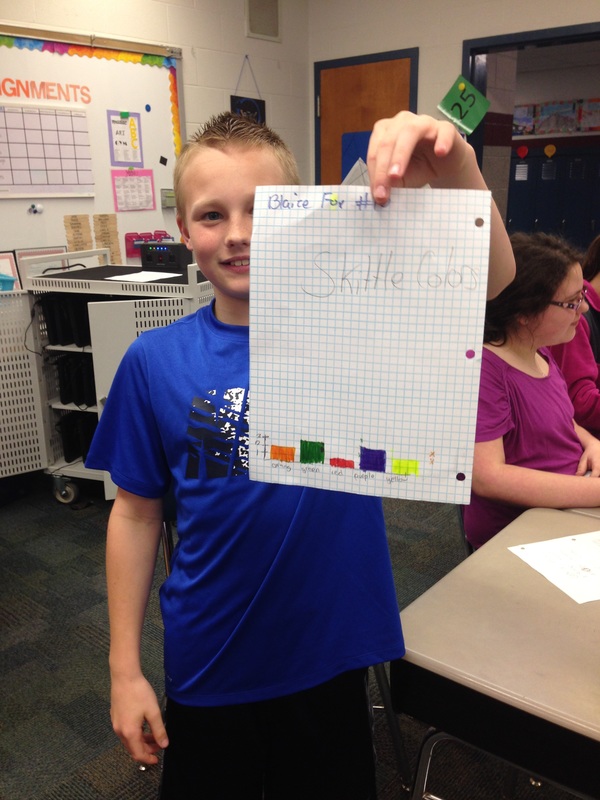
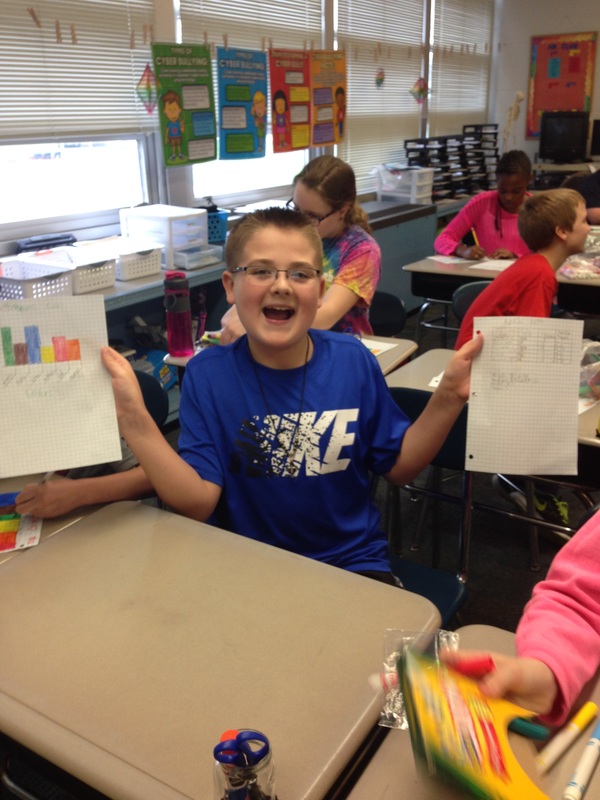
Here are some pictures of the Candy Graphs we completed. They were given either Skittles or M&Ms (their choice!), and first created a tally chart and frequency table with cumulative frequency. Next, they found the mean, median, mode, and range of their data. The second stage was creating the bar graph, complete with determining the scale and including a title and labels. The third stage was to write observations about their data, make predictions using their data, and then create questions that could be answered by using their data.
Helpful Links:
Practice Answering Questions About Line Graphs (IXL)
Create Bar Graphs (simple)
Create Bar Graphs (advanced)
Create Line Graphs (simple)
Create Line Graphs (advanced)
Explanation of Line Plots (YouTube Video)
Create Line Plots (IXL)
Interpret Line Plots (IXL)
Create and Interpret Line Plots with Fractions (IXL)
Here are some pictures of the Candy Graphs we completed. They were given either Skittles or M&Ms (their choice!), and first created a tally chart and frequency table with cumulative frequency. Next, they found the mean, median, mode, and range of their data. The second stage was creating the bar graph, complete with determining the scale and including a title and labels. The third stage was to write observations about their data, make predictions using their data, and then create questions that could be answered by using their data.